What is this tool?
This tool creates a 3D surface plot where z = f(x,y). The user can specify the function that is to be plotted. Symbolic Math Expressions are evaluated client-side using Math.JS's' expression evaluator and 3D rendering and interaction is done by Three.JS.
I built this tool as a free quick-reference for individuals wanting to create visualize a 3D surface plot. Although there other tools such as Wolfram Alpha and Matlab that can perform this same function, each has it's own set of limitations 1:
- WolframAlpha does not give many customization options nor allow you to interact with output surface plots.
- Although MatLab does a very good job with built-in surface plot visualizations (using the surf function), it's not free.
- There are some decent visualizations out there with tools like Desmos and Geogebra, but I haven't found one I really like
How do I use it?

- Click and drag to interact with surface plot.
- Use the mouse-wheel to zoom in and out.
- Use right-click to translate the camera, though be warned that many modern web-browsers will interpret these as gestures by default and will perform actions like "Go Back"
Observing the top part of right hand menu tells us:
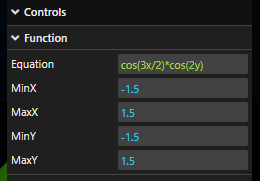
- We are plotting the equation z = cos(3x/2)*cos(2y)
- Across the interval (-1.5, 1.5) on the X-Axis
- And across the interval (-1.5, 1.5) on the Y-Axis
Mousing over any part of the surface will display a sphere on the surface along with the coordinates at that point:

Could I see some Usage Examples?
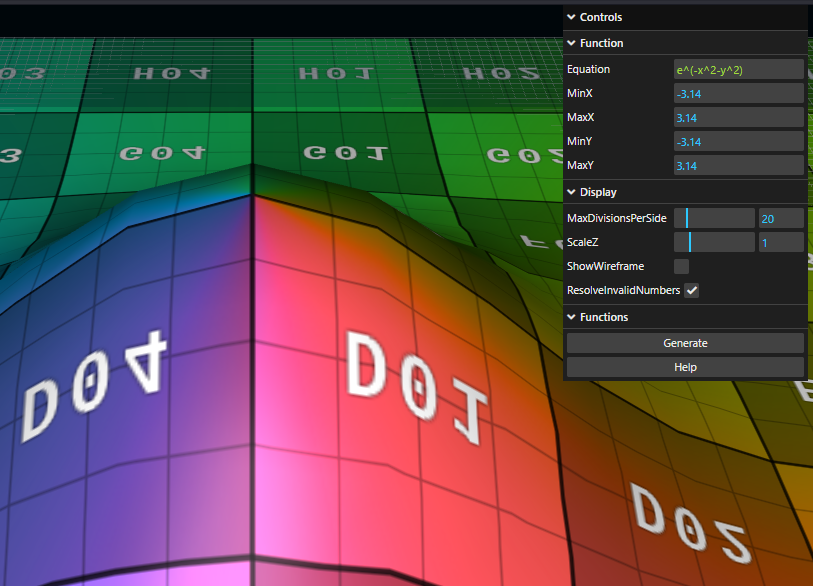
Here's an example of plotting e^(-x^2-y^2) first over (-pi, pi) on both the X and Y axis:
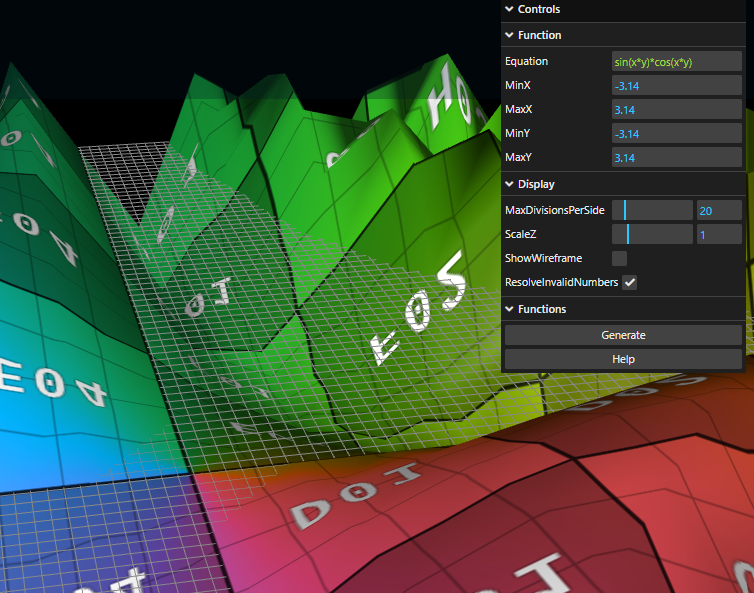
Here's another example of plotting sin(x*y)*cos(x*y) first over (-6, 6) on both the X and Y axis:
What does MaxDivisionsPerSide do?
Let's first set the equation to sin(x*y) over (-6,6) in both directions and turn ShowWireframe on.
Now let's observe what happens as I change the MaxDivisionsPerSide:
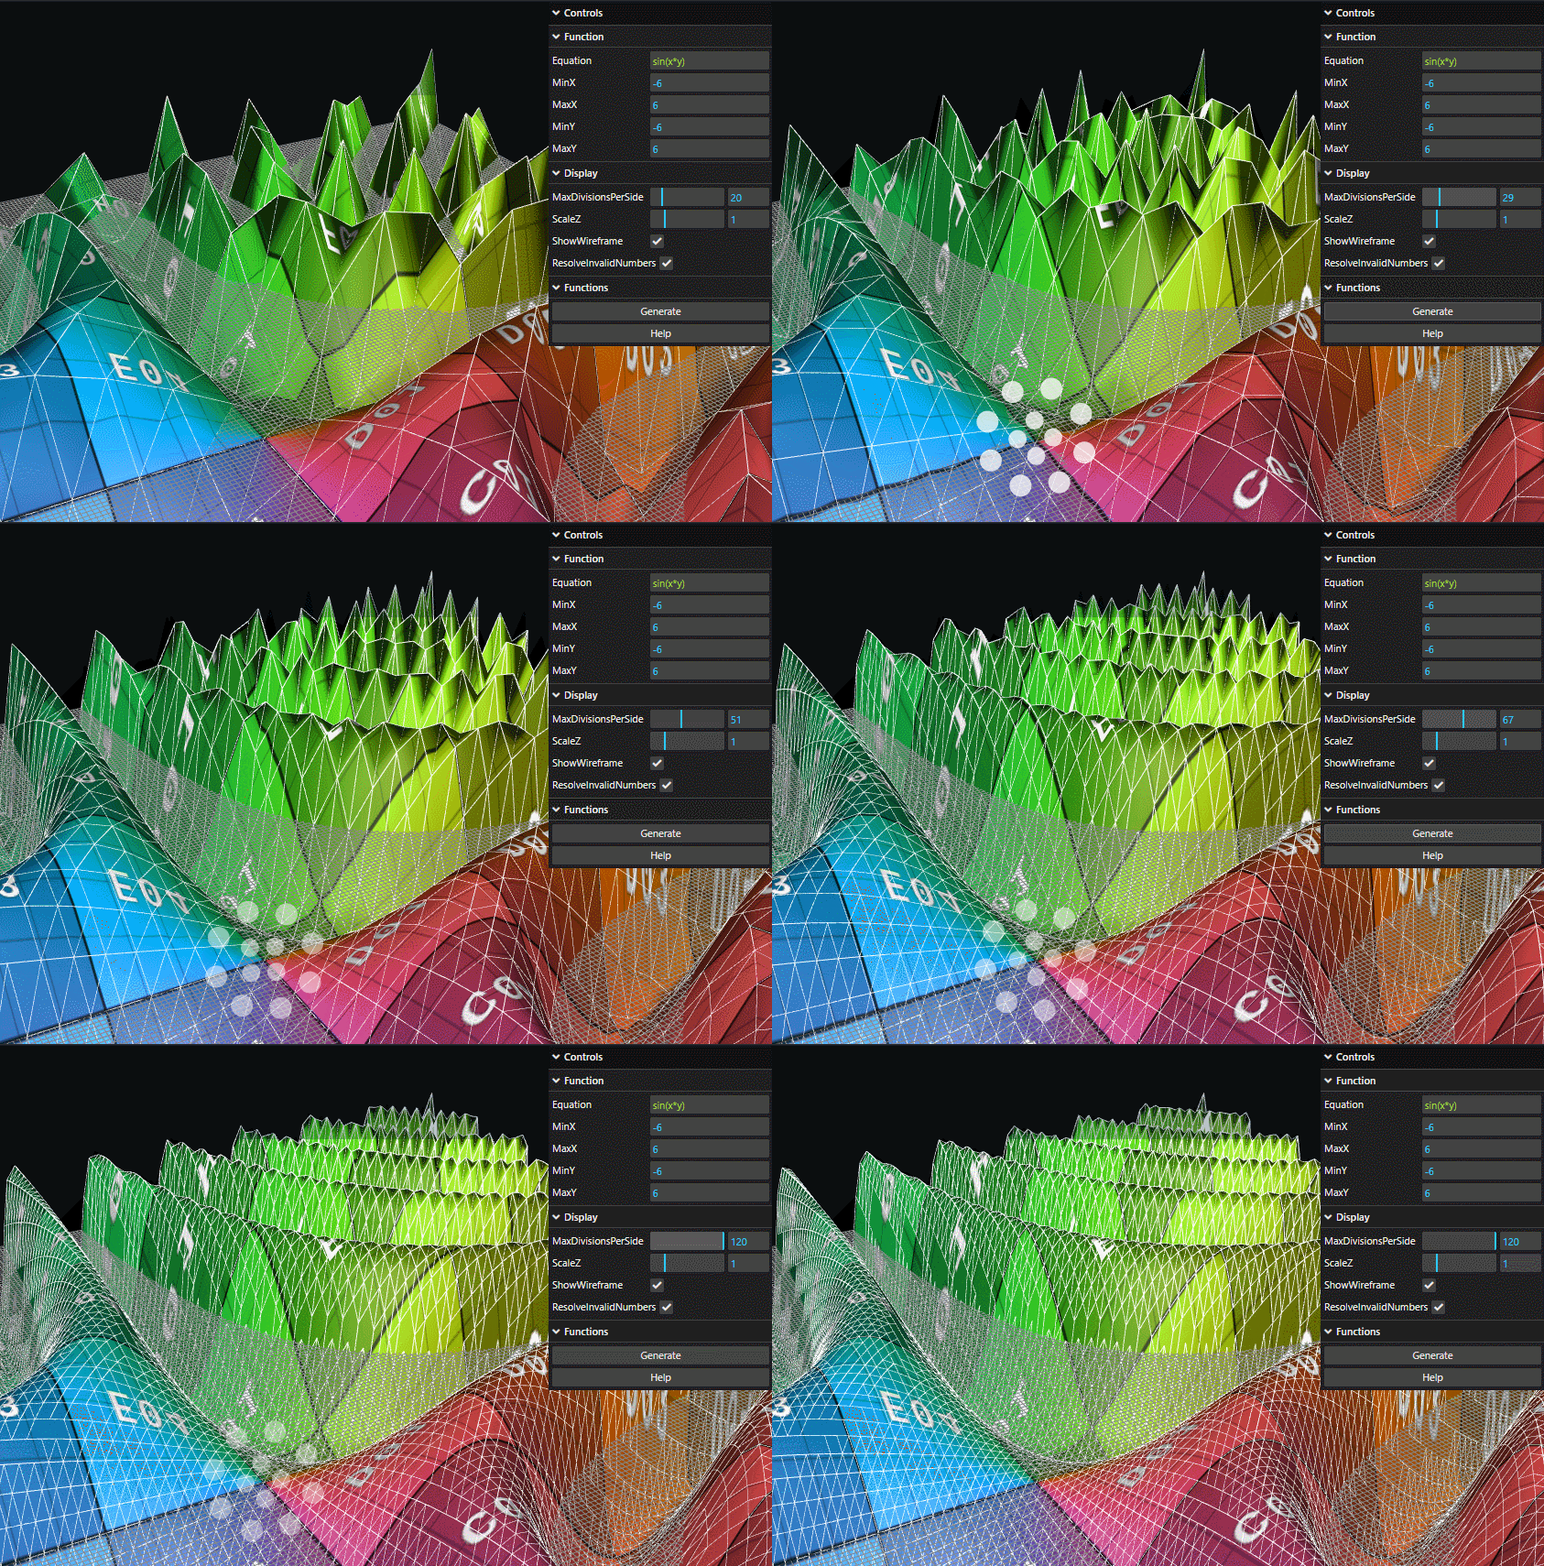
- We're subdividing the surface into rectangles and calculating the value for each point on that rectangle.
- The more subdivisions we have, the better the approximation for the function is.
- The more subdivisions we have, the longer it takes to calculate. Processing power is limited!
- If this all sounds extremely familiar, this is the same concept as Riemann Sums!
What does ResolveInvalidNumbers do?
Let's set our equation to something that will obviously not evaluate for certain points. Let's set it to sin(x*y)/(x*y).
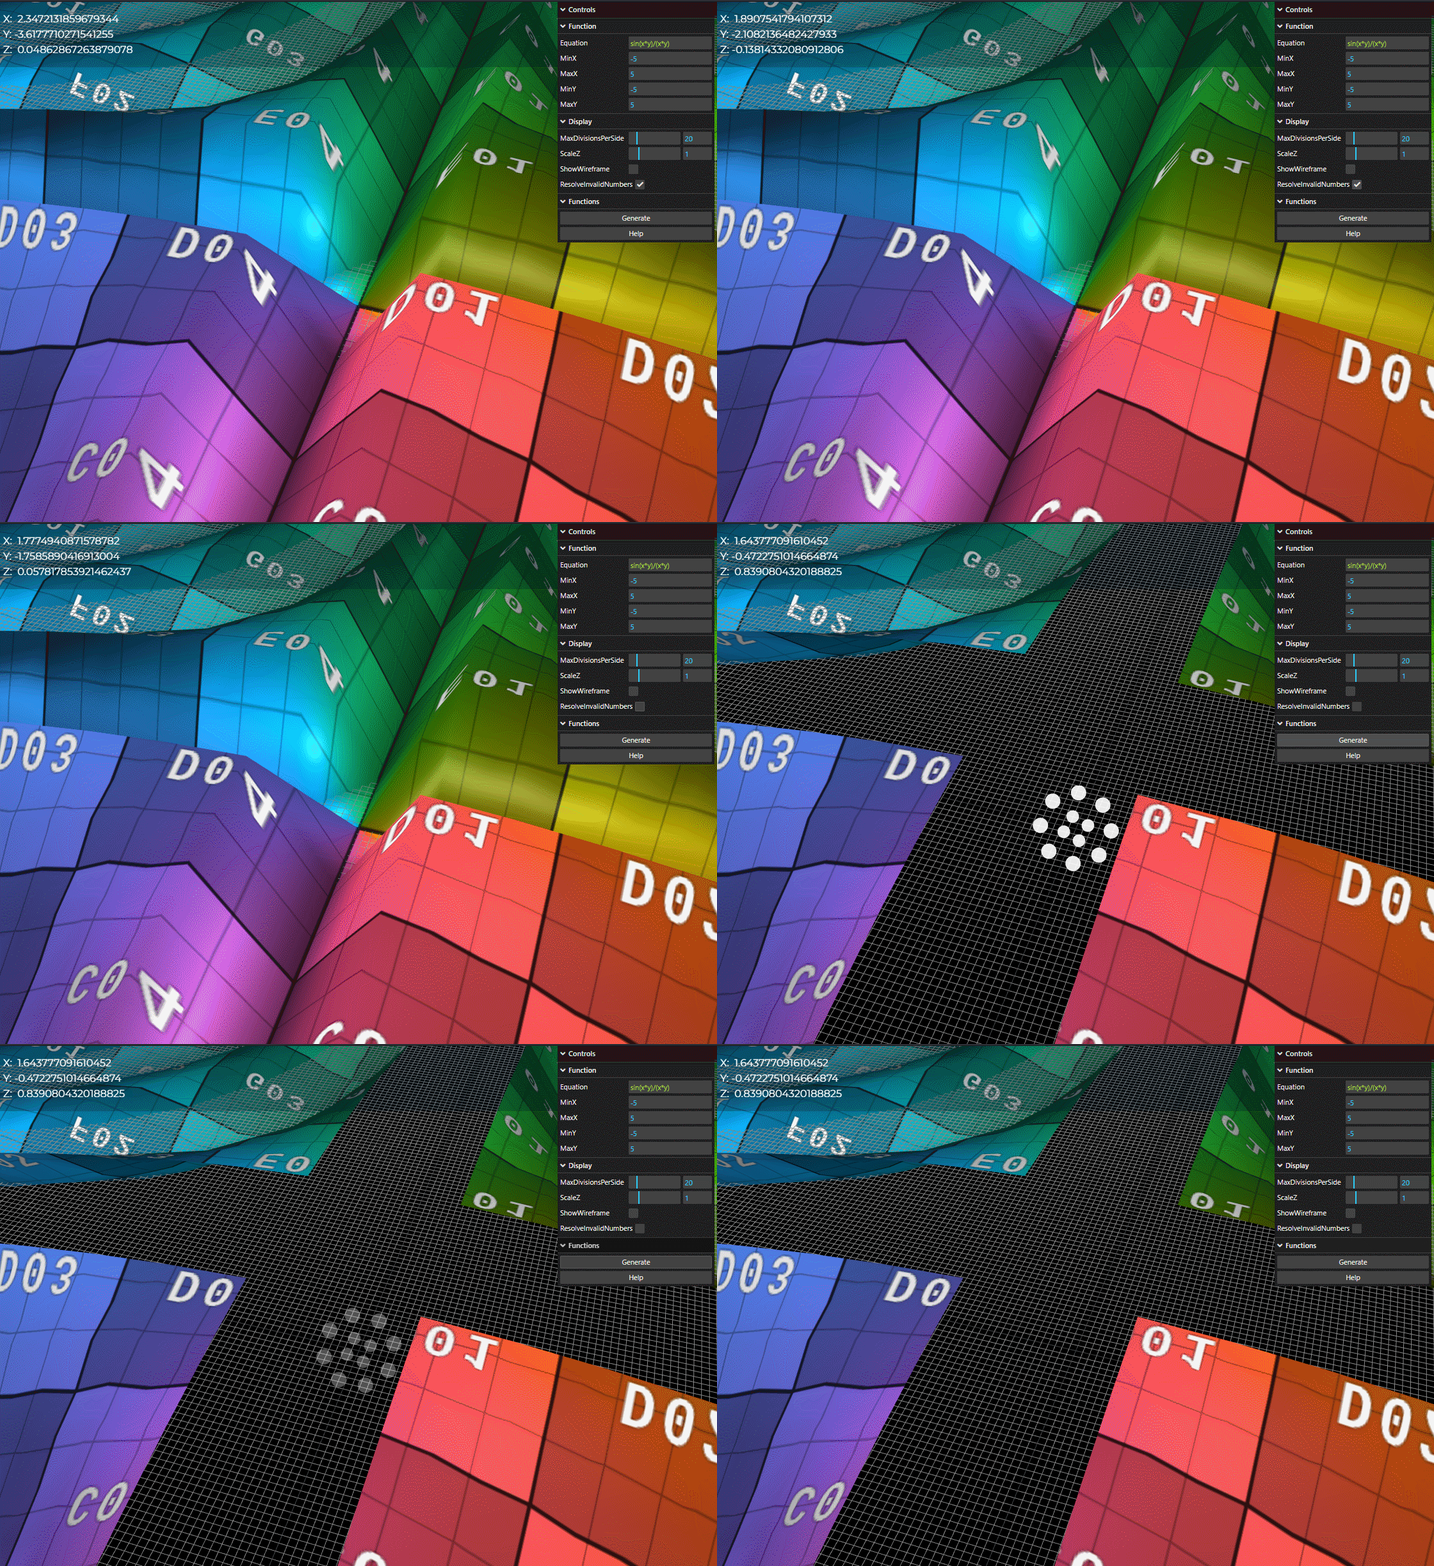
- Whenever x = 0 or y = 0, the function will divide by zero.
- If we use ResolveInvalidNumbers, the application will either attempt to bound infinities and set undefined numbers to 0 to prevent errors or holes in the surface.
- If we disable ResolveInvalidNumbers, the application will attempt to build a surface with undefined values or values that go to Infinity.
- Notice X/Y/Z values aren't populating when we disable ResolveInvalidNumbers.
Who do I contact for suggestions/help/feedback?
I welcome any sort of feedback or suggestions for this tool. Currently, the best way to contact me is using the Contact Page at my main site at Drakeor.com